Autism in Numbers and Minds: Diagnoses and Google Trends 2016–2023
The proportion of autism diagnoses among 0–5-year-olds (T1 group) more than doubled, rising from ~12% in 2016 to ~27% in 2023.
5/4/20254 min read
Autism in Numbers and Minds: Diagnoses and Google Trends 2016–2023
Abstract
This study explores the rising prevalence of Autism Spectrum Disorder (ASD) diagnoses alongside growing public curiosity, using national health survey data and online search behavior analysis. Data from the National Survey of Children’s Health (NSCH) and Google Trends (2016–2023) show parallel increases in autism diagnoses and search interest. Analysis reveals that public awareness, often fueled by major media events and celebrity disclosures, tends to rise faster than formal diagnosis rates. Furthermore, early detection in young children (0–5 years) has shown notable improvement. These trends highlight not only the expanding visibility of autism but also the evolving cultural understanding of neurodiversity.
1. Introduction
Autism Spectrum Disorder (ASD) diagnoses have been steadily increasing over the past decade. Alongside clinical growth, public awareness, as reflected in online search behavior, has also evolved. This article explores the connection between actual autism prevalence trends and public curiosity about autism topics, using data from the National Survey of Children's Health (NSCH) and Google Trends from 2016 to 2023.
2. Data and Variables
2.1 Data Sources
National Survey of Children's Health (NSCH) (2016–2023): Nationally representative U.S. survey data on child health, collected from parents.
Google Trends (2016–2023): Public search interest data for the keyword "autism" (normalized to 0–100).
2.2 Variables from NSCH
2.3 Variables from Google Trends
2.4 Overview of Autism Diagnosis Data
To provide an overview of the NSCH autism diagnosis data across survey years, the total number of survey responses and diagnosed cases was analyzed year-by-year and broken down by age group.
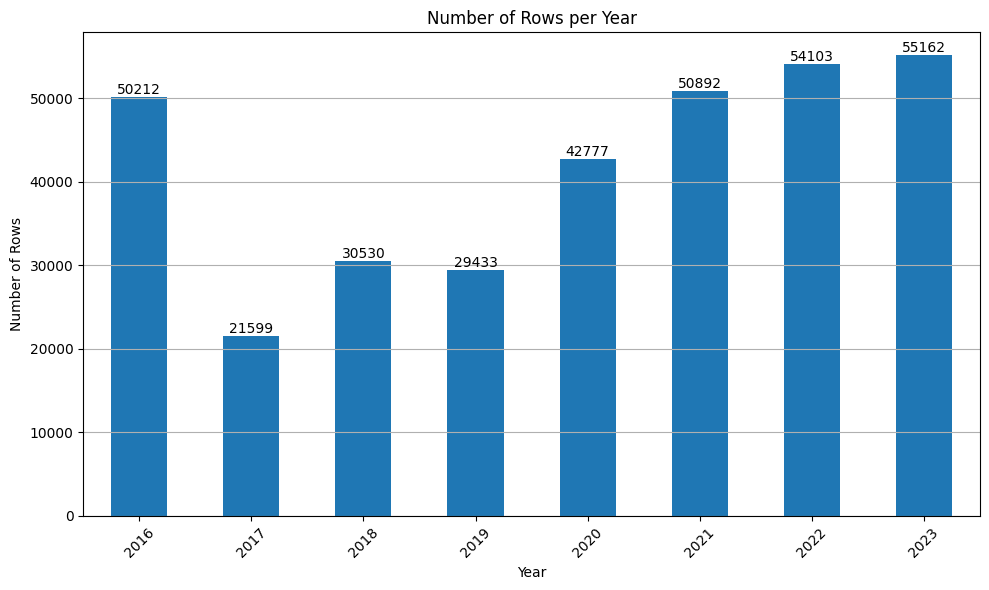
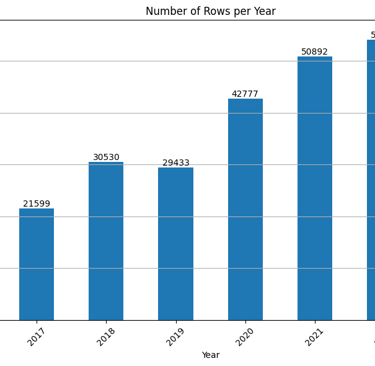
Figure 1: Number of Survey Responses per Year (2016–2023)
Description:
This bar chart shows the total number of surveyed children (rows in the dataset) per year from 2016 to 2023.Key Observations:
2016 had a very high sample size (~50,000 children).
A sharp drop occurred in 2017 (~21,599 children), likely due to changes in survey design.
Sample sizes recovered gradually from 2018 onward.
From 2021 to 2023, NSCH achieved record-high survey sizes (>50,000 per year), improving the reliability of prevalence estimates.
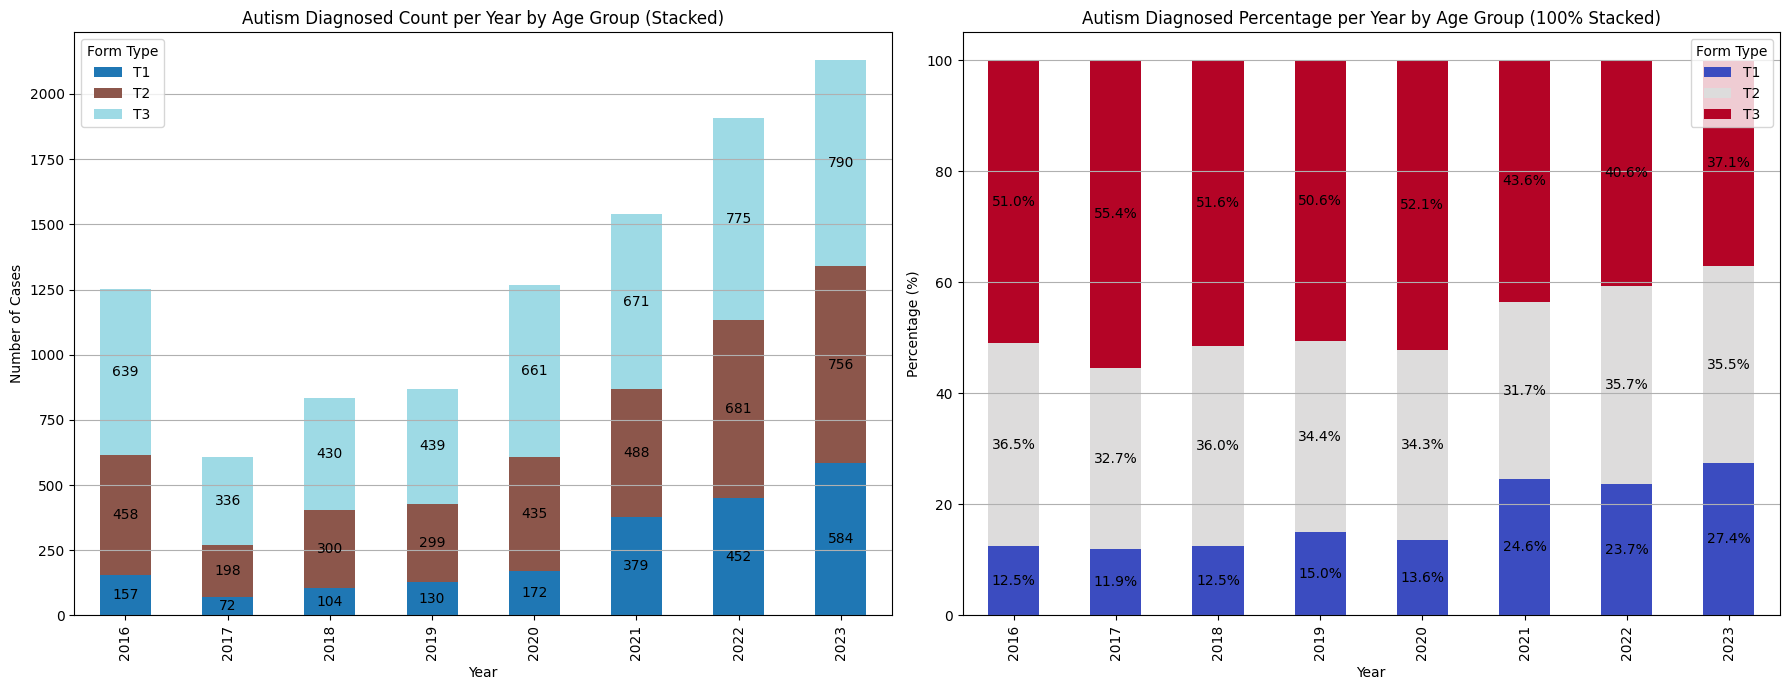
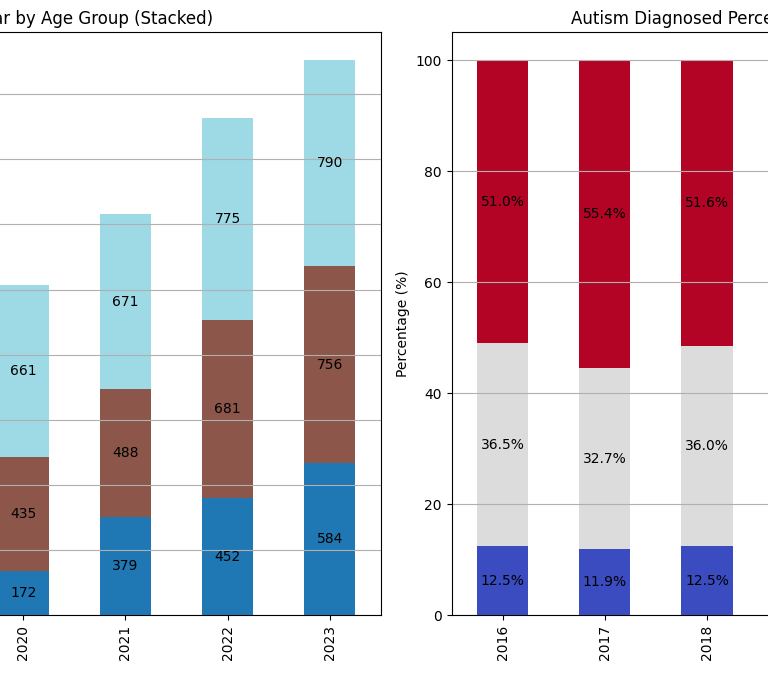
Figure 2: Autism Diagnosed Cases by Age Group (Counts and Percentages)
Left Chart: Stacked Bar Plot (Counts per Year)
Shows the absolute number of diagnosed autism cases each year, broken down by:
T1 (0–5 years)
T2 (6–11 years)
T3 (12–17 years)
Observations:
Total diagnoses are increasing steadily after 2020.
Diagnoses among younger children (T1) are growing noticeably.
Diagnoses among older teenagers (T3) are proportionally shrinking.
Right Chart: 100% Stacked Bar Plot (Percentage per Year)
Shows the percentage split of diagnoses across age groups each year.
Observations:
The percentage of 0–5-year-olds (T1) diagnosed increased from ~14% in 2016 to ~18% in 2023.
The share of diagnoses among older teens (T3) decreased over time.
The middle childhood group (T2) stayed relatively stable.
3. Results
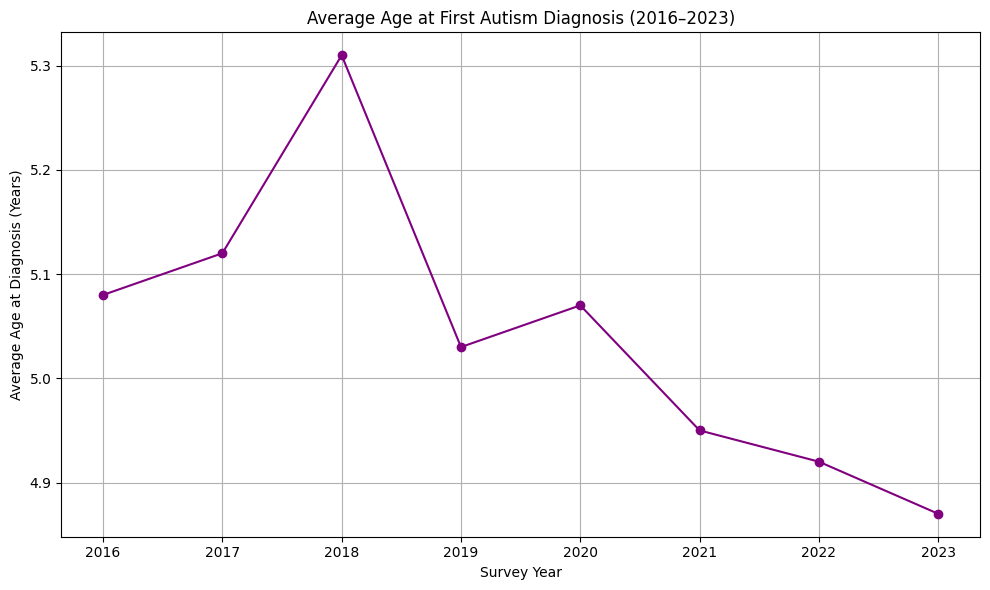
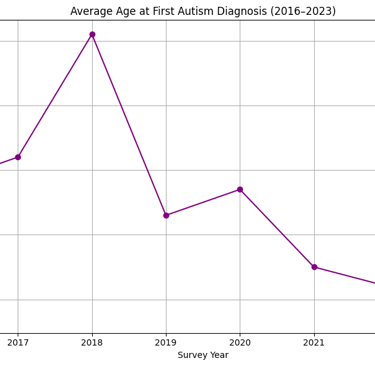
3.1 Average Age at Diagnosis
The average age at first autism diagnosis peaked at approximately 5.3 years in 2018 and steadily declined to about 4.87 years by 2023, the youngest average recorded during the study period. This trend indicates progress in recognizing and diagnosing autism earlier in children's developmental stages.
Analysis of the average age at first autism diagnosis revealed a significant downward trend between 2018 and 2023. After peaking at approximately 5.3 years in 2018, the average diagnosis age steadily declined to about 4.87 years in 2023, the youngest average recorded during the study period. This trend suggests that earlier screening practices, increased public awareness, and improved acceptance of autism may be contributing to the earlier identification of children on the spectrum.
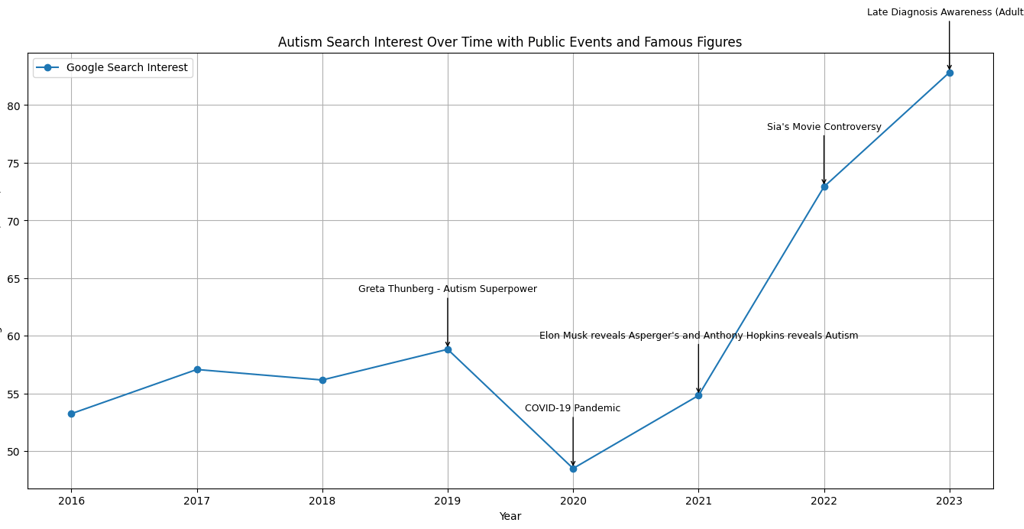
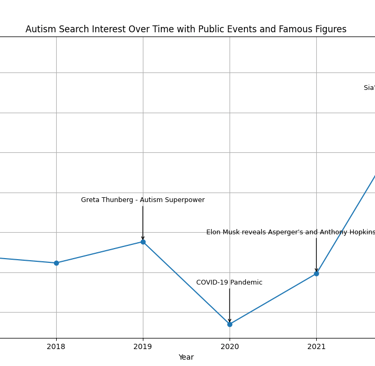
3.2 Google Trends Interest and Impact of Public Events
Analysis of Google Trends data revealed that public search interest for "autism" showed a generally upward trajectory between 2016 and 2023. A modest decline occurred in 2020 during the COVID-19 pandemic, likely reflecting a shift in public attention toward immediate health crises. However, search interest rebounded strongly thereafter, reaching its highest level in 2023.
Overlaying major public events onto the Google Trends data highlighted clear correlations between media moments and spikes in autism-related searches. Notable increases in search interest aligned with events such as Greta Thunberg’s framing of autism as a "superpower" in 2019, Elon Musk's public disclosure of his Asperger’s diagnosis on Saturday Night Live in 2021, and a surge in late-diagnosis awareness discussions in 2023, particularly among adults and on social media platforms. These patterns suggest that public figures and major media moments significantly drive societal curiosity and awareness about autism.
4. Conclusion
This study highlights that autism is becoming more visible in clinical settings and broader public consciousness. Between 2016 and 2023, autism diagnosis rates steadily increased, while public search interest in autism topics surged even faster, particularly following key media events and celebrity disclosures. The parallel rise of medical diagnoses and public attention underscores a growing societal recognition of autism and neurodiversity. Importantly, the data suggest progress in early detection efforts, with younger children being diagnosed earlier than in previous years — a crucial step toward improving long-term outcomes through timely intervention. However, growing awareness must be matched with action. Efforts must continue to ensure equitable access to screening, diagnostic services, support systems, and accurate public education, especially for historically underserved communities. Reducing stigma and embracing neurodiversity as a valued part of human variation remains a central challenge and opportunity. Awareness is the beginning. Action must follow
5. References
National Survey of Children's Health (NSCH)
https://www.childhealthdata.org/Google Trends Documentation
https://support.google.com/trends/Lai, M.-C., Lombardo, M. V., & Baron-Cohen, S. (2014).
"Autism." The Lancet, 383(9920), 896-910.The United States Census Bureau, Associate Director for Demographic Programs, National Survey of Children’s Health
https://www.census.gov/programs-surveys/nsch/data/datasets.html
6. Help and Acknowledgments
Portions of this work were supported using generative AI tools (e.g., OpenAI’s ChatGPT) for assistance.